How to Use Excel to Manage a Small Business (The Complete Guide)
When you are first getting your company off the ground, investing in expensive enterprise software rarely makes sense. Microsoft Excel is the undisputed Swiss Army knife of business software. It is affordable, infinitely customizable, and fully capable of running your daily operations.
However, learning how to use Excel to manage a small business is vastly different from using it to make a simple grocery list. Without a strict structural framework, business spreadsheets quickly devolve into a chaotic web of broken links, #REF! errors, and duplicated data.
Whether you are tracking cash flow, managing inventory, or organizing client leads, this guide will show you exactly how to build resilient, professional-grade Excel systems that scale with your operations.
Table of Contents
How to Use Excel to Manage a Small Business: The Golden Rule
Most business owners make a critical mistake on day one: they mix data entry, calculations, and visual reporting on the exact same worksheet. When you try to format a raw expense log to look like a printable monthly report, you make the data incredibly difficult to summarize later.
To use Excel effectively, you must adopt the Input-Process-Output (IPO) Framework:
- Input (Raw Data): These are your “Ledger” tabs. Data is entered in continuous, flat rows. No blank rows, no merged cells, and no fancy colors.
- Process (Calculations): Hidden tabs where you keep lookup lists (like your Chart of Accounts or product SKUs) and complex background calculations.
- Output (Dashboards): The visually appealing reporting tabs. These tabs contain Pivot Tables, charts, and aggregate formulas that pull from your Input tabs. You never type raw numbers here.
By keeping your raw data separate from your reports, your business spreadsheets will remain stable, fast, and accurate.
1. How to Manage Small Business Finances in Excel
For many freelancers and small teams, Excel serves as a lightweight accounting system. To manage small business finances in Excel accurately—and keep your records compliant with standard bookkeeping practices outlined by the SBA—you need a transactional ledger, not a grid of monthly boxes.
Setting Up Your Income & Expense Ledger
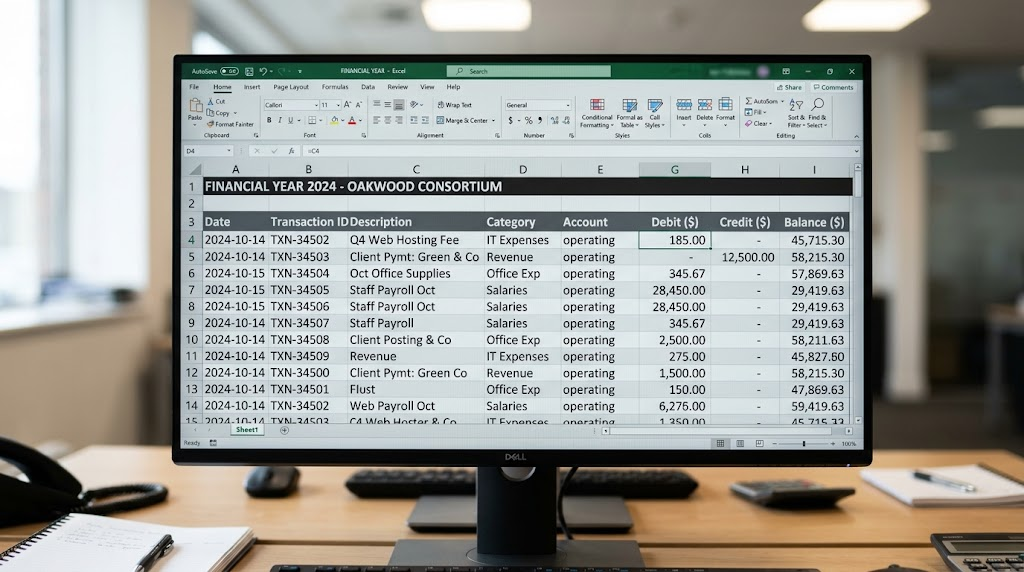
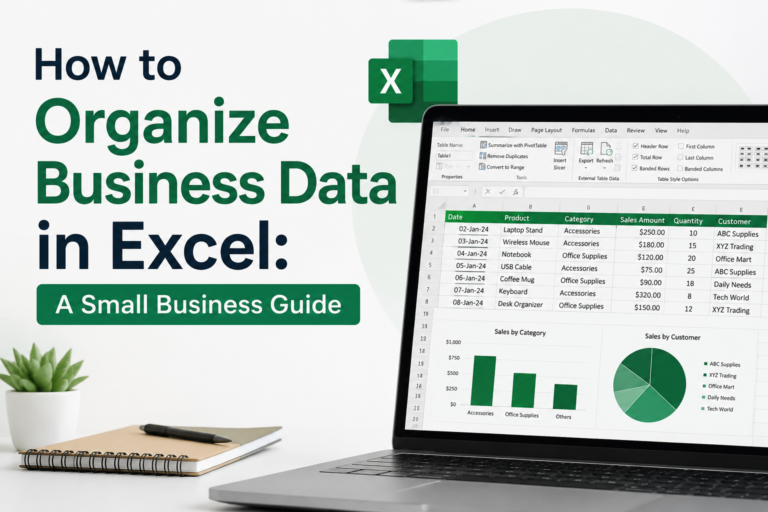
Create a dedicated worksheet named Financial_Ledger. Convert your data range into a formal Excel Table by pressing Ctrl + T. This ensures formulas automatically expand as you add new transactions.
Use the following column headers for your ledger:
| Column Header | Data Type | Example | Purpose |
| Date | Date | 10/15/2026 | For sorting and monthly reporting |
| Transaction ID | Text | TXN-104 | Unique identifier for bank reconciliation |
| Type | Dropdown | Expense | Classifies cash flow direction |
| Category | Dropdown | Software | Maps to your Chart of Accounts |
| Vendor/Client | Text | Google Workspace | Tracks who you paid or who paid you |
| Amount | Currency | $24.00 | The raw transaction value |
| Status | Dropdown | Cleared | Tracks unpaid invoices vs. cash in bank |
With this flat table structure, you can insert a Pivot Table on a separate “Dashboard” tab to instantly generate a Profit & Loss (P&L) statement with a few clicks.
2. Using Excel for Small Business Inventory Management
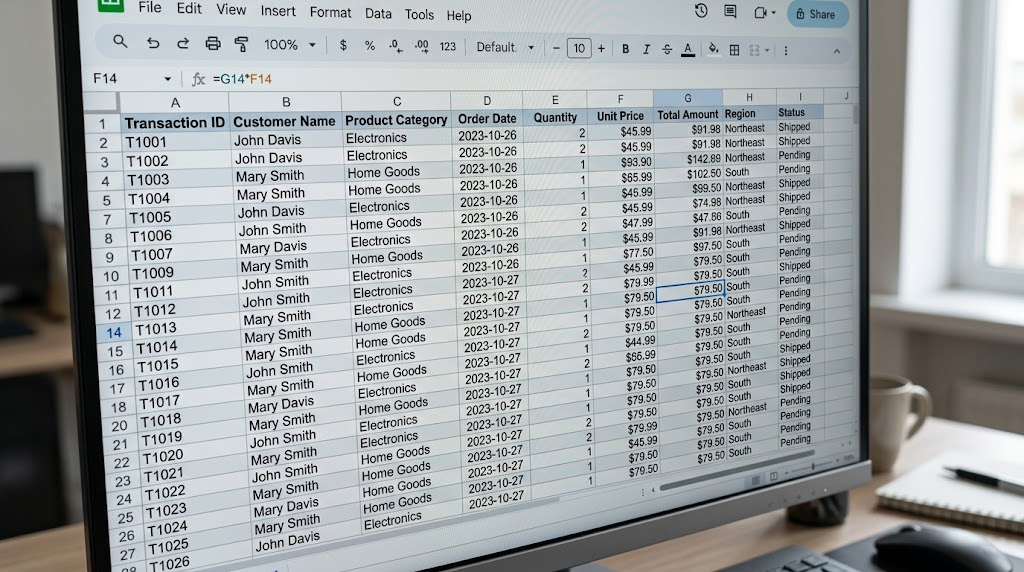
If you sell physical products, running out of stock costs you money, but holding too much stock ties up your cash flow. Excel can serve as an excellent perpetual inventory system if structured correctly.
Instead of just having one sheet where you manually update a “Current Quantity” number (which leaves no historical record), use two tables:
- The Product Master List: A table containing static data like
SKU,Product Name,Unit Cost, andReorder Target. - The Inventory Movement Log: A continuous log where you record every time stock enters or leaves the warehouse.
Inventory Log Columns:
DateSKUTransaction Type(e.g., Purchase Order, Sale, Return, Damage)Quantity(Positive numbers for additions, negative for sales/removals)
You can then use a simple SUMIFS formula on your Master List to calculate the exact current stock level by summing all movements for a specific SKU.
3. Building a Basic Excel CRM for Client Management
You do not necessarily need a costly Customer Relationship Management (CRM) platform to track early sales leads. Excel can manage your pipeline perfectly if you standardize your inputs.
Create a Pipeline table to track prospective clients through your sales stages.
Essential CRM Columns:
Lead DateCompany NameContact PersonEmail/PhoneDeal Value (Est)Pipeline Stage(Dropdown: Lead, Contacted, Proposal Sent, Won, Lost)Next Follow-Up Date
Pro Tip: Use Excel’s Conditional Formatting on the Next Follow-Up Date column. Set a rule to highlight the cell in red if the date is equal to or less than TODAY(). This turns your spreadsheet into an automated daily task list.
4 Essential Excel Formulas Every Business Owner Needs
To stop managing your small business spreadsheets manually and start automating them, you need to master a few core formulas.
1. SUMIFS (Targeted Financial Totals)
Used to sum values that meet specific criteria (e.g., Total Revenue for January, or Total Expenses spent on Advertising).
=SUMIFS(Ledger[Amount], Ledger[Type], "Expense", Ledger[Category], "Advertising")
2. XLOOKUP (Data Matching)
Replaces the outdated VLOOKUP. Use it to automatically pull a product’s price onto an invoice by searching for its SKU. If you are new to this function, Microsoft’s official XLOOKUP guide provides excellent advanced examples. =XLOOKUP(A2, Products[SKU], Products[Price], "Not Found")
3. IFERROR (Clean Dashboards)
Prevents ugly #DIV/0! or #N/A errors from showing up on your executive dashboards when data is missing.
=IFERROR(YourFormula, 0)
4. Data Validation (Drop-Down Lists)
This is a feature, not a formula, but it is vital. Go to Data > Data Validation to force users to select options from a drop-down list (like categories or pipeline stages). This prevents one employee from typing “Marketing” and another typing “Ads,” which would break your reporting.
3 Common Spreadsheet Mistakes That Ruin Business Data
- Hardcoding Numbers in Formulas: Never type
=SUM(A1:A10) + 150because you forgot to log a $150 transaction. Always enter the $150 as a new row in your raw data. Hidden hardcoded numbers destroy financial accuracy. - Using 12 Monthly Tabs: Creating separate tabs for “January Sales,” “February Sales,” etc., makes it impossible to analyze annual trends without writing massive, complex formulas. Keep all data in one master table and use a Pivot Table to filter by month.
- Mixing Text and Numbers: If a cell is meant for currency, do not type “$100 (estimated)” into the cell. The text breaks the calculation engine. Keep numbers pure and add a separate column titled
Notes.
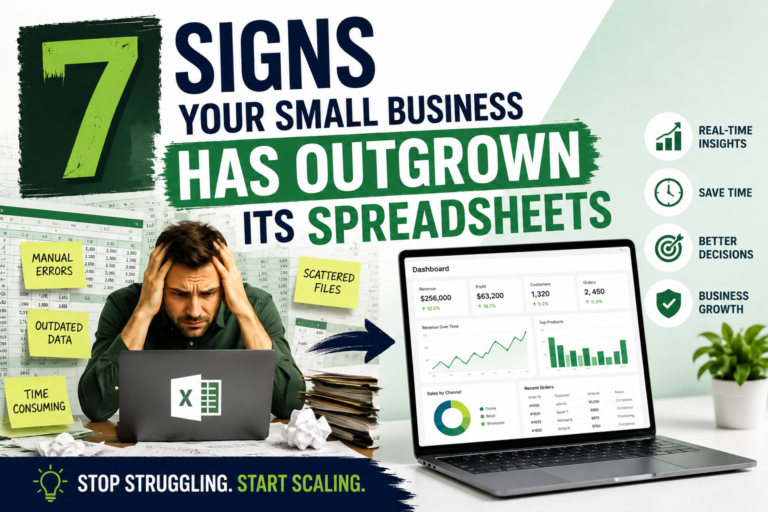
5 Signs Your Small Business Has Outgrown Excel
Excel is powerful, but it is not a database. As your business scales, you will eventually hit operational ceilings. The signs your small business has outgrown its spreadsheets include:
- Version Control Nightmares: You regularly find files named
Master_Ledger_Final_v4_USE_THIS_ONE.xlsxon your desktop. - Concurrency Issues: Multiple team members need to edit the file at the exact same time, leading to locked files or overwritten data.
- Sluggish Performance: Your file size exceeds 50,000 rows, and formulas take several seconds or minutes to calculate every time you press Enter.
- Complex Multi-Channel Sales: You are trying to manually stitch together daily CSV exports from Shopify, Stripe, Amazon, and PayPal.
- Security and Audit Needs: You require strict user permissions (e.g., an employee can view inventory but cannot view payroll data) which Excel cannot securely enforce.
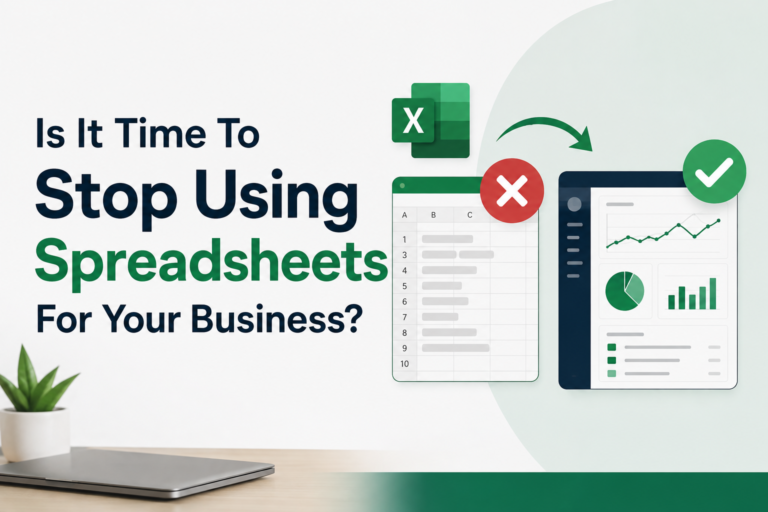
When these symptoms appear, it is time to migrate to dedicated accounting software (like QuickBooks or Xero), a cloud CRM (like HubSpot), or upgrade your data reporting to Microsoft Power BI.
Until then, by adhering to strict data rules and mastering basic formulas, Excel will serve as a highly effective, low-cost command center for managing your small business operations.
Read Also: 7 Signs Your Small Business Has Outgrown Its Spreadsheets