What Business Data Should a Small Business Track Every Week?
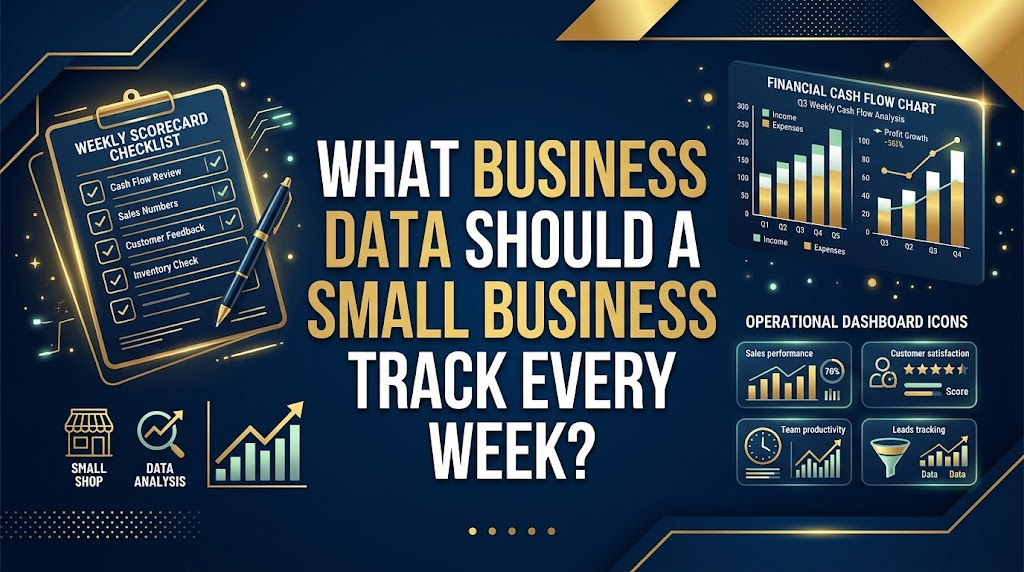
Running a small business means managing tight margins and shifting cash flow. For many entrepreneurs, waiting until the end of the month or quarter to review financial statements is a dangerous habit. When asking what business data should a small business track every week, the answer lies in building a consistent operational rhythm rather than treating data as an annual tax chore. Transitioning to a weekly review transforms how you run your company, allowing you to catch collection delays, spot margin squeezes, and optimize team bandwidth before small issues impact your bottom line.
Table of Contents
Why Monthly Reviews Are Too Late for Small Businesses
Financial statements provided by traditional accountants are historical artifacts. They tell you what happened 30 days ago, but they offer zero insight into what is happening right now.
Weekly data tracking acts as your business radar. It gives you enough lead time to alter marketing spend, accelerate client follow-ups, or pause non-essential software subscriptions before cash flow runs dry.
What Business Data Should a Small Business Track Every Week: Financial KPIs
Weekly Financial Pulse Metrics to Review:
- 1. Operating Cash Flow: Monitor incoming cash versus outgoing bills.
- 2. Accounts Receivable Aging: Track overdue client invoices weekly.
- 3. Gross Profit Margins: Check profitability per service line.
- 4. Weekly Burn Rate: Keep close watch on operating overhead.
Read Also: 10 Excel Mistakes That Can Ruin Small Business Reports (And How to Fix Them)
1. Operating Cash Flow and Net Cash Position
- What It Measures: The exact amount of liquid cash entering and leaving your business bank accounts over the past 7 days, plus your projected cash position for the next 30 days.
- Why Track It Weekly: Profit on paper does not equal cash in the bank. Knowing your net cash position prevents bounced supplier payments or missed payroll checks.
- How to Track It: Maintain a rolling 30-day cash forecast ledger in Excel, subtracting scheduled fixed outflows from cleared incoming customer receipts.
For a detailed overview of how liquidity impacts business health, review Investopedia’s guide on operating cash flow
2. Accounts Receivable (AR) Aging and Overdue Invoices
- What It Measures: Total unpaid invoices grouped by how late they are (Current, 1–30 days overdue, 31–60 days overdue).
- Why Track It Weekly: Allowing client invoices to drift past their payment terms silently starves your working capital.
- How to Track It: Review your invoice ledger weekly. Automate multi-step payment reminders for any invoice sitting past due for more than 3 days.
3. Gross Profit Margin by Product or Service Line
- What It Measures: Revenue remaining after subtracting the direct costs associated with producing your goods or delivering your services.$$\text{Gross Margin} = \frac{\text{Revenue} – \text{Cost of Goods Sold (COGS)}}{\text{Revenue}} \times 100$$
- Why Track It Weekly: Supplier costs fluctuate, and software subscriptions creep up. Tracking margins weekly ensures you spot unprofitable service packages immediately.
You may Also like: How to Use Excel to Manage a Small Business (The Complete Guide)
4. Weekly Burn Rate and Fixed vs. Variable Expenses
- What It Measures: Total cash spent operating the business each week to keep the lights on and operations running.
- Why Track It Weekly: Unchecked subscription creep and ad-spend waste drain small business accounts quickly. Reviewing expenses weekly keeps overhead tightly controlled.
Operational Data to Monitor Every Week
Financial metrics reveal the score, but operational metrics reveal how well your team is playing the game.
5. Sales Pipeline Volume and Conversion Velocity
- What It Measures: Number of new inbound leads, active proposals sent, and closed deals over the past week.
- Why Track It Weekly: Sales slumps take weeks to show up in revenue reports. Monitoring your pipeline weekly lets you ramp up outreach before revenue drops.
6. Order Fulfillment and Customer Support Turnaround Times
- What It Measures: Average hours or days required to ship a product, onboard a client, or resolve a support ticket.
- Why Track It Weekly: Slow fulfillment speeds destroy customer retention and spike refund requests.
- How to Track It: Log ticket resolution times inside your CRM or support desk software and review averages weekly.
7. Team Capacity and Billable Utilization Rates
- What It Measures: Percentage of working hours your team spends on revenue-generating client work versus internal administration.
- Why Track It Weekly: For service-based businesses and agencies, tracking utilization prevents employee burnout and highlights when it is time to hire freelancers or full-time staff.
How to Build a 30-Minute Weekly Data Review Routine
You do not need an enterprise software suite to run a weekly review. Set aside 30 minutes every Monday morning using a structured spreadsheet workflow:
- Pull Raw Exports (5 Mins): Export last week’s transaction CSVs from your bank feeds, payment processor (Stripe/PayPal), and invoicing software.
- Refresh Your Master Ledger (10 Mins): Drop the new rows into your master Excel table (
Ctrl + T) and verify that data validation rules caught any formatting errors. - Review Summary Dashboards (10 Mins): Open your executive summary tab powered by Pivot Tables and
SUMIFSformulas to check cash flow, AR aging, and pipeline volume. - Take Action (5 Mins): Note 1 or 2 operational bottlenecks that need immediate correction, assign follow-up tasks to your team, and get back to growth.
Read Also: 7 Signs Your Small Business Has Outgrown Its Spreadsheets
Frequently Asked Questions
What is the single most important metric a small business should track weekly?
Operating cash flow is the most critical metric. Without a clear view of your available cash runway, sales figures and profit margins matter very little.
How do I stop spending hours manually compiling weekly reports?
Stop copying and pasting data across multiple monthly tabs. Maintain a single continuous master transaction table, use formal Excel Tables (Ctrl + T), and leverage Excel’s Power Query feature to automate data cleaning and imports.
Should I track website traffic and social media metrics weekly?
While marketing metrics like traffic and impressions are useful, they are secondary indicators. Prioritize financial and operational metrics (cash flow, AR aging, fulfillment speed) first before diving into social media vanity metrics.
How often should a small business review its financial statements?
While formal P&L statements and balance sheets are reviewed monthly or quarterly with an accountant, small business owners should review core financial metrics—such as cash flow, cash runway, and overdue invoices—every single week to catch cash crunches early.
What is the difference between financial and operational KPIs?
Financial KPIs measure the monetary health and profitability of your company (such as cash flow, margins, and burn rate). Operational KPIs measure the efficiency of your daily workflows and team productivity (such as order fulfillment speed, sales pipeline velocity, and billable utilization).
How do I track accounts receivable aging effectively?
Track accounts receivable (AR) aging by maintaining a ledger that categorizes unpaid customer invoices into aging buckets: Current, 1–30 days overdue, 31–60 days overdue, and 60+ days overdue. Review this list weekly and automate payment reminder emails for any invoice past due by more than 3 days.
What metrics should be on a weekly small business scorecard?
A balanced weekly small business scorecard should feature four key financial metrics (Operating Cash Flow, AR Aging, Gross Margin, and Weekly Burn Rate) alongside three operational metrics (New Sales Pipeline Leads, Order/Support Fulfillment Time, and Team Utilization Rate).
How do I calculate gross profit margin for service businesses?
For service businesses, gross profit margin is calculated by taking total service revenue, subtracting the direct cost of delivering those services (like freelance contractor fees or direct software tools used for clients), dividing by total revenue, and multiplying by 100 to get a percentage.