How to Organize Business Data in Excel: A Small Business Guide
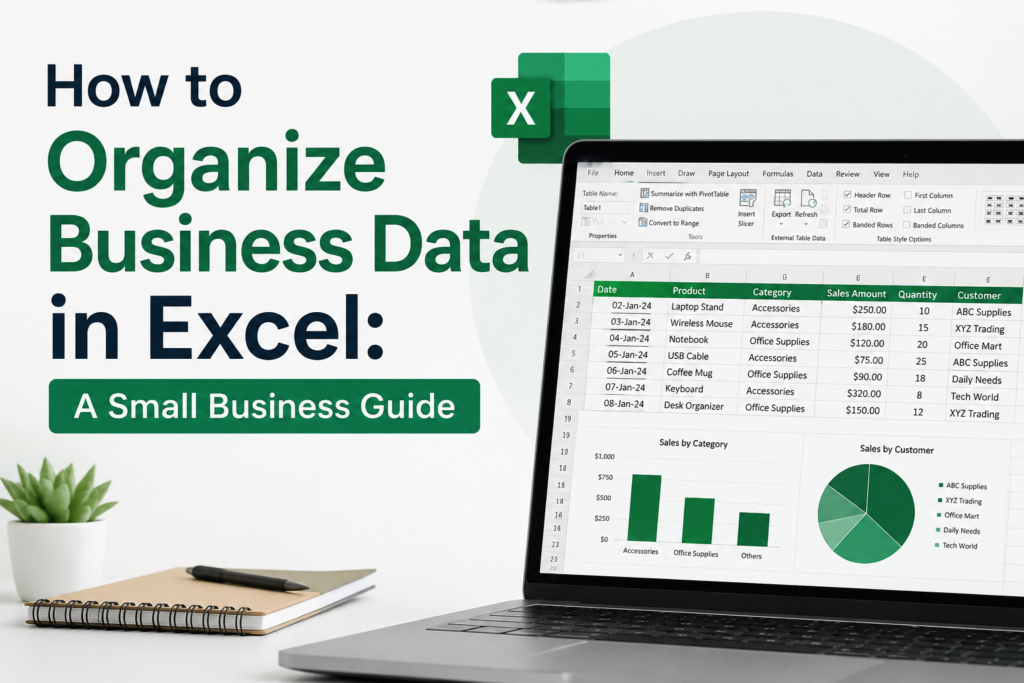
Running a small business means constantly juggling receipts, customer lists, inventory counts, and financial ledgers. When starting out, investing in expensive enterprise resource planning (ERP) software is rarely practical or necessary. Instead, mastering foundational spreadsheet tools like Microsoft Excel or Google Sheets gives business owners total visibility over operations without breaking the bank.
However, building a sustainable system requires more than dumping numbers into blank cells. Without a thoughtful architectural foundation, early-stage spreadsheets quickly devolve into broken formulas, mismatched tracking dates, and corrupted lookups.
How to Organize Business Data in Excel Using Modular Workbooks
The single biggest mistake beginners make is attempting to cram every aspect of their company into one gigantic, endless worksheet. When sales figures, customer addresses, expense categories, and inventory counts live on the same grid, maintenance becomes a nightmare. Instead of an endless scroll, professional spreadsheet design relies on a modular workbook architecture. Each distinct business function gets its own dedicated tab within a single Excel workbook, linked together dynamically using modern formulas. For an in-depth look at structuring your data containers, you can review Microsoft’s official guide on Excel tables. This compartmentalization keeps data entry clean, speeds up calculations, and ensures reports remain crystal clear as transaction volumes scale.
Step 1: Design Your Core Business Tabs
A functional small business workbook should separate operational domains into distinct tables. Setting up these foundational sheets prevents data overlap and establishes clear ownership for every metric you track.
1. The Master Inventory & Product Catalog (tbl_Inventory)
This tab acts as the single source of truth for every product or service you sell. Format this range as an official Excel table (Ctrl + T) so formulas can reference it dynamically.
- Core Columns:
SKU,Item_Description,Category,UnitPrice,CostPrice,ReorderLevel
2. The Daily Sales & Transaction Ledger (tbl_Ledger)
Every time a transaction occurs, a new row is appended here. Never hardcode prices or descriptions directly into this sheet; instead, record the transaction ID and SKU, then pull details dynamically from your master catalog.
- Core Columns:
TransactionID,Date,SKU,QuantitySold,CustomerEmail,PaymentStatus
Read Also: 7 Signs Your Small Business Has Outgrown Its Spreadsheets
3. The Customer & Client Directory (tbl_CRM)
Keep a centralized directory of everyone who buys from or contracts with your business. This prevents duplicate entries and simplifies lifetime value calculations.
- Core Columns:
CustomerID,ClientName,Company,Email,Phone,DateAcquired
4. Expense & Overhead Tracker (tbl_Expenses)
Track every dollar leaving the business immediately. Categorize expenses meticulously to simplify end-of-year accounting.
- Core Columns:
ExpenseID,Date,Vendor,Category(e.g., Software, Shipping, Marketing),Amount,TaxDeductible
Step 2: Enforce Strict Data Governance and Formatting Rules
Data integrity is the bedrock of reliable business reporting. If your raw inputs contain typos, trailing spaces, or inconsistent formatting, your financial dashboards will output inaccurate totals.
Enforce Consistent Table Formatting
Always reserve the top row for column headers. Apply a bold fill color, freeze the top row so headers remain visible during scrolling, and convert ranges into formal Excel tables. Formal tables automatically expand formulas down new rows and maintain formatting consistency.
Eliminate Trailing Spaces and Inconsistent Casing
Raw data imports—such as CSV exports from payment gateways or e-commerce plugins—frequently contain invisible trailing spaces that break lookup formulas.
| Status | Data State | Issue & Solution |
| ❌ | " acme corporation " | Trailing spaces break lookups and filters. |
| ✔ | "acme corporation" | Cleaned using the =TRIM() function. |
| ✔ | "Acme Corporation" | Standardized casing using =PROPER(). |
Running text cleanup formulas on imported data guarantees that customer names and product SKUs match seamlessly across different tabs.
Step 3: Implement Scalable Formulas Instead of Hardcoding
Hardcoding numbers directly into summary cells is the fastest way to ruin a business report. When a customer requests a refund or a vendor changes pricing, hardcoded models require manual recounting. Professional spreadsheets rely on automated, robust lookup and aggregation logic.
Dynamic Retrieval with XLOOKUP
When generating customer invoices or sales receipts, never type product descriptions manually. Instead, use an XLOOKUP formula linked to your master inventory table:
Excel
=XLOOKUP(A2, tbl_Inventory[SKU], tbl_Inventory[UnitPrice], 0)
- How it works: Excel searches for the SKU entered in cell
A2inside the inventory table’s SKU column, retrieves the corresponding unit price, and defaults to0if the SKU is not found.
You May Also Like: 10 Business Processes Small Businesses Should Stop Managing Manually
Period-over-Period Aggregation with SUMIFS
To track monthly revenues without rebuilding formulas every 30 days, pair SUMIFS with date bounds generated by the EOMONTH function. This allows dashboards to dynamically calculate totals based on a selected month header in cell B1.
Excel
=SUMIFS(
    tbl_Ledger[Amount],
    tbl_Ledger[Date], ">=" & B$1,
    tbl_Ledger[Date], "<=" & EOMONTH(B$1, 0)
)
This single formula automatically aggregates every transaction occurring within the calendar month specified in B$1, regardless of total row count.
Step 4: Establish a Sustainable Weekly Data Tracking Routine
Even the most advanced spreadsheet model fails if data entry is neglected. To stay ahead of cash flow crunches and inventory shortages, commit to a strict operational cadence.
Every Monday morning, set aside 45 to 60 minutes to execute a simple data hygiene routine:
- Import Bank & Gateway Transactions: Download CSV files from your payment processor or bank ledger, clean whitespace using
TRIM, and paste them into your master ledger tab. - Reconcile Expenses: Categorize all unassigned business expenses incurred over the prior week.
- Audit Inventory Levels: Cross-reference physical stock counts or dropshipping fulfillment logs with your
tbl_Inventoryreorder thresholds. - Review Key Metrics: Check your rolling monthly revenue, outstanding accounts receivable, and top-performing product lines.
Consistent weekly maintenance prevents data backlogs, eliminates end-of-month panic, and ensures your financial pulse remains accurate and actionable.
Conclusion
Organizing small business data with simple spreadsheets does not require a degree in data science. By splitting workbooks into dedicated operational tabs, enforcing strict structural and data-cleaning rules, replacing hardcoded cells with dynamic formulas, and committing to a weekly review habit, you turn chaotic digital paperwork into a structured engine for growth. Build these habits early, and your operations will scale smoothly long before you ever need to upgrade to enterprise software.
Read Also: 10 Essential Excel Functions for Small Business Owners (With Real Examples)
Frequently Asked Questions
What is the best way to organize business data in Excel or Google Sheets?
The best approach is to use a modular workbook architecture rather than dumping everything into one sheet. Separate your operations into dedicated, structured tables like a master inventory catalog, a transaction ledger, a customer CRM directory, and an expense tracker, then link them dynamically using formulas.
How do I stop lookup formulas from failing due to trailing spaces?
Raw CSV imports from payment gateways and e-commerce platforms often contain invisible spaces that break lookups. You can clean these imported text strings automatically by running the =TRIM() function to remove extra spaces and combining it with =PROPER() to standardize text casing.
Why should I avoid hardcoding numbers in my business spreadsheets?
Hardcoding figures directly into summary cells destroys spreadsheet flexibility. When prices change, refunds occur, or expenses update, hardcoded models require manual recounting and are prone to human error. Instead, use automated retrieval functions like XLOOKUP and aggregation formulas like SUMIFS.
What core tabs does a small business workbook need?
A robust small business financial workbook should contain at least four core tabs: a master product/service inventory table (tbl_Inventory), a daily sales transaction ledger (tbl_Ledger), a client contact directory (tbl_CRM), and an overhead expense tracker.
How often should I update and review my small business data?
Establish a consistent weekly data hygiene routine—such as a 45 to 60-minute session every Monday morning. Use this time to import bank or payment processor transactions, categorize recent expenses, cross-reference inventory thresholds, and review rolling cash flow metrics.
Can I use Excel formulas to calculate monthly revenue automatically?
Yes. You can use period-over-period aggregation formulas by pairing SUMIFS with date bounds driven by the EOMONTH function. This setup allows your financial reports to automatically aggregate all transactions within a specific month header without requiring manual cell range adjustments.