How to Structure Spreadsheets for Small Business Reporting (Step-by-Step Guide)
Learning how to structure spreadsheets for small business reporting is critical because most workbooks do not break due to bad math—they break because they mix data entry, calculations, and visual presentation inside the exact same worksheet.
When you track transactions, calculate profit margins, and format a printable monthly summary on a single tab, adding new rows or adjusting formulas risks breaking the entire workbook. To generate clean, reliable weekly and monthly reports, your spreadsheets must follow professional structural principles.
Structuring your workbooks using a database-first mindset eliminates formula errors, manual copy-pasting, and messy end-of-month reconciliations.
Table of Contents
The Core Problem: Human-Readable vs. Machine-Readable Data
Humans read data horizontally across matrices with custom colors, merged headers, and blank spacing rows for visual clarity. Computers and spreadsheet calculation engines (like Excel and Google Sheets) process data vertically in structured, flat tables.
❌ BAD: Human-Formatted Entry (Breaks Formulas and Pivot Tables)
| Region | Jan Rev | Feb Rev | Mar Rev |
| North | $10,000 | $12,000 | $11,500 |
| South | $8,500 | $9,000 | $9,200 |
✔ GOOD: Machine-Readable Normalized Table (Enables Instant Reporting)
| Date | Region | Category | Amount |
| 2026-01-15 | North | Revenue | 10000 |
| 2026-01-20 | South | Revenue | 8500 |
| 2026-02-12 | North | Revenue | 12000 |
| 2026-02-18 | South | Revenue | 9000 |
When data is entered in a cross-tabulated grid (months running across columns), writing dynamic aggregation formulas like SUMIFS or refreshing a Pivot Table requires constant formula rewrites every month. When data is recorded as continuous single-row records, generating reports takes seconds.
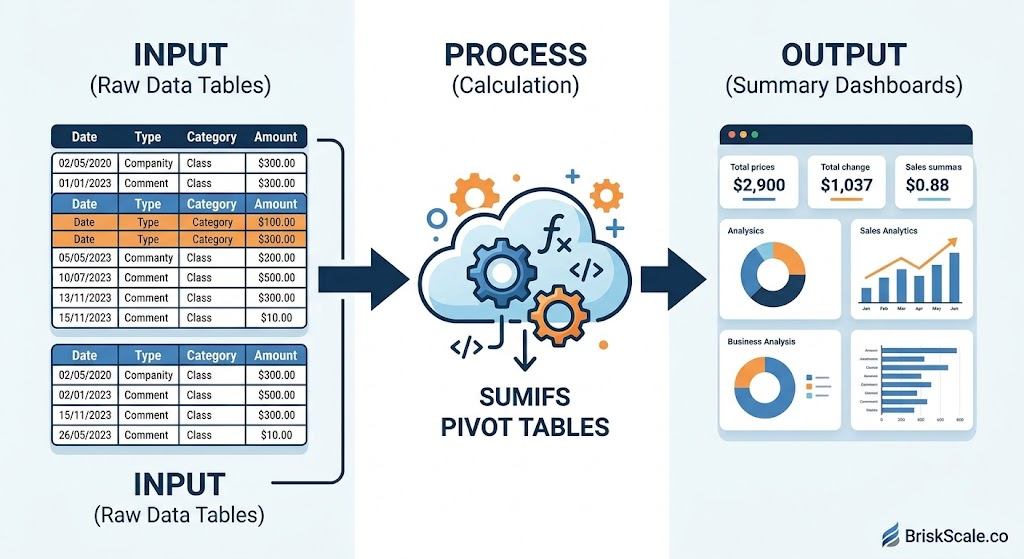
The 3-Tier Architecture: Input, Process, Output (IPO)
To build durable spreadsheets, separate your workbook into three distinct operational layers across dedicated tabs:
- Input Tabs: Raw Flat Data
- Processing Tabs: Calculations / Logic
- Output Tabs: Dashboards / Reports
1. Input Layer (Raw Data Tables)
- Contains pure transactional logs (invoices, expenses, hours logged, leads).
- Zero formatting fluff: no merged cells, no bold totals, no manually colored cells.
- Each row represents one discrete transaction or event.
2. Processing Layer (Calculations & Staging)
- Houses intermediate calculation grids, lookup validation tables, parameter controls (e.g., tax rates, standard markups), and complex logic modeling.
- Typically hidden from regular team members to prevent formula tampering.
3. Output Layer (Dashboards & Reports)
- The presentation tab used by business owners, investors, or clients.
- Features clean KPI cards, monthly comparison tables, chart visualizations, and filtered views driven entirely by dynamic formulas or Pivot Tables reading from the Input Layer.
- Cells are locked/protected so users cannot accidentally overwrite background formulas.
You May Also Like: 10 Business Processes Small Businesses Should Stop Managing Manually
4 Fundamental Rules for Flat Data Entry
To ensure your raw input tabs can easily feed your reports, adhere to these structural standards:
- Single-Row Headers: Keep column headers on Row 1 only. Never use stacked, multi-level, or merged header rows in raw data tabs.
- One Data Type Per Column: If a column is designated as a Date, every cell in that column must contain a valid serial date. Never enter text notes like
"Pending"or"TBD"into a date or currency column. - No Embedded Summary Rows: Never insert subtotal or “Grand Total” rows inside your transactional data. Summaries belong exclusively in the Output layer.
- Never Use Merged Cells: Merged cells destroy cell referencing, make vertical sorting impossible, and corrupt downstream lookup formulas like
XLOOKUPorINDEX/MATCH.
Step-by-Step: How to Structure Spreadsheets for Small Business Ledgers
A standard small business transaction tracker should capture financial events cleanly using normalized columns.
Standard Schema for an Income and Expense Ledger
| Column Name | Data Type | Example Entry | Purpose |
Transaction_ID | Text / Alpha-Numeric | TXN-10042 | Unique key for auditing and reconciliations |
Date | Date (YYYY-MM-DD) | 2026-03-01 | Allows date grouping and period filtering |
Type | Text (Dropdown) | Expense | Broad categorization (Income vs. Expense) |
Category | Text (Dropdown) | Software Subscriptions | Standardized Chart of Accounts category |
Entity / Vendor | Text | Google Workspace | Counterparty name |
Amount | Number (2 Decimals) | 36.00 | Raw value (always positive; Type dictates sign) |
Payment_Method | Text (Dropdown) | Credit Card - 4102 | Tracks cash vs. liability accounts |
Status | Text (Dropdown) | Cleared | Operational workflow tracking |
1. Enforce Clean Inputs with Data Validation
Prevent human typos by applying Data Validation (drop-down lists) to categorical columns:
- Select the
Categorycolumn in your input tab. - In Excel, go to Data > Data Validation > List. In Google Sheets, select Data > Data validation > Add rule > Dropdown (from a range).
- Point the rule to a dedicated lookup list on your Processing tab. This prevents variations like
"Advertising","Ads", and"advert"from fragmenting your reporting categories.
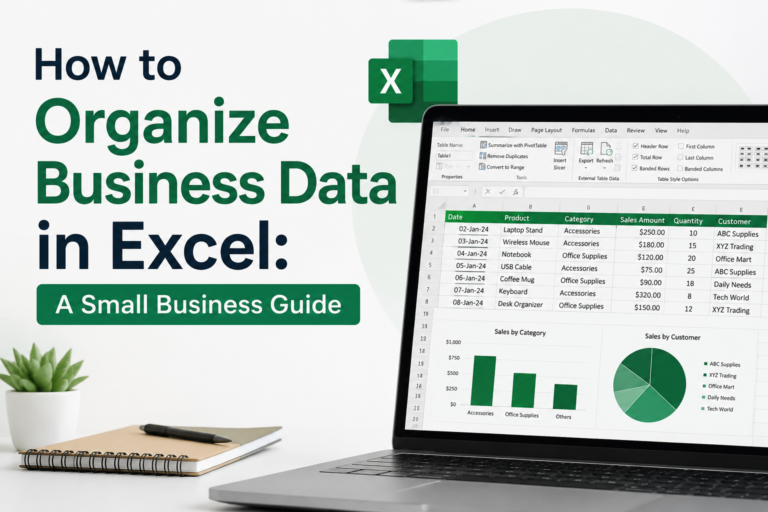
Read Also: How to Organize Business Data in Excel: A Small Business Guide
2. Convert Raw Ranges into Official Tables
Never leave raw data as a floating range of unformatted cells.
- In Excel, select your data and press
Ctrl + T(Windows) orCmd + T(Mac) to convert the range into a formal Excel Table, and rename it (e.g.,tbl_Transactions). - In Google Sheets, use Format > Convert to table.
Benefits of Formal Tables:
- Formulas expand automatically when new rows are pasted at the bottom.
- Structured references (e.g.,
tbl_Transactions[Amount]) replace fragile grid coordinates (A2:A500). - Downstream charts and Pivot Tables update with a single click without manually updating the source range.
Connecting Raw Data to Summary Reports
Once data is stored in a clean, flat table, use two primary methods to build your summary dashboards:
Method 1: Pivot Tables (Fastest, Drag-and-Drop)
Pivot tables let you group transactions by month, vendor, or category without writing complex equations.
- Click inside
tbl_Transactionsand select Insert > PivotTable. - Place the Pivot Table on your Output tab.
- Drag
Dateto Rows (group by Year/Month). - Drag
Categoryto Rows (nested under Month). - Drag
Amountto Values (set calculation toSUM). - Add a Slicer for
Type(Income/Expense) to make interactive reports for team reviews.
You May Also Like: 7 Signs Your Small Business Has Outgrown Its Spreadsheets
Method 2: Dynamic Summary Formulas (Custom Formatted Reports)
If you require custom-styled P&L layouts with specific indentation, use dynamic aggregate formulas pointing to your structured table.
Dynamic Monthly Category Expense Formula:
Excel
=SUMIFS(
    tbl_Transactions[Amount],
    tbl_Transactions[Category], "Software Subscriptions",
    tbl_Transactions[Type], "Expense",
    tbl_Transactions[Date], ">=2026-03-01",
    tbl_Transactions[Date], "<=2026-03-31"
)
To make this formula fully dynamic across monthly columns:
- Replace hardcoded date strings with cell references pointing to month-start dates in your header (e.g., cell
C$1). - Calculate the end-of-month bound dynamically using
=EOMONTH(C$1, 0).
Excel
=SUMIFS(
    tbl_Transactions[Amount],
    tbl_Transactions[Category], $B4,
    tbl_Transactions[Type], "Expense",
    tbl_Transactions[Date], ">=" & C$1,
    tbl_Transactions[Date], "<=" & EOMONTH(C$1, 0)
)
5 Critical Spreadsheet Habits to Eliminate
| Bad Habit | The Business Risk | The Professional Fix |
Hardcoding values inside formulas (e.g., =SUM(A1:A10) + 450) | When numbers change, hardcoded adjustments remain hidden, corrupting historical accuracy. | Place all adjustment figures into dedicated raw data rows with explanatory notes. |
Creating 12 monthly tabs (Jan, Feb, Mar…) | Requires updating 12 separate sets of formulas and makes annual aggregation tedious. | Use one single master data tab with a Date column; filter dynamically on summary tabs. |
Mixing text and numbers (e.g., writing "N/A" or "$100 est" in an amount column) | Causes #VALUE! errors in downstream calculations and excludes rows from SUM functions. | Restrict columns strictly to numeric data types; add a separate Notes column for text. |
| Leaving summary dashboards unprotected | Colleagues or clients can accidentally overwrite complex formulas. | Lock calculation cells and protect the Output sheet under Review > Protect Sheet. |
Saving untracked local desktop files (Ledger_v2_final.xlsx) | High risk of file corruption, data loss, and accidental version overwrites. | Store workbooks in cloud directories (OneDrive, SharePoint, Google Drive) with auto-versioning enabled. |
When to Transition Beyond Spreadsheets
While structured spreadsheets can scale to tens of thousands of rows, small businesses eventually hit ceilings where specialized software or relational databases are required. For guidance on when to scale your data models beyond desktop tools, you can review Microsoft’s official Power BI documentation on data sources. Consider upgrading your data architecture if:
- Your file size exceeds 50,000 rows and workbook calculation speeds drop significantly.
- Multiple staff members edit simultaneously, leading to sync conflicts and overwritten records.
- Your reporting requires multi-source data blending across disparate platforms (e.g., Stripe, Shopify, QuickBooks, and CRM databases). In this scenario, connecting raw spreadsheet tables to Microsoft Power BI or Looker Studio provides stronger reporting pipelines without manual exports.
- Adopting the Input-Process-Output structure today ensures that even if you eventually migrate to dedicated accounting tools or Business Intelligence systems, your underlying business data remains clean, standardized, and immediately exportable.
Read Also: How to Use Excel to Manage a Small Business (The Complete Guide)
Frequently Asked Questions
What is the best way to name columns in small business spreadsheets?
Use short, descriptive headers without spaces or special characters (e.g., Order_Date, Unit_Cost, Client_ID). This makes writing structured references and Power Query transformations simpler and less prone to syntax errors.
Should I use Excel or Google Sheets for business reporting?
Both tools support clean data architecture:
Choose Google Sheets for real-time collaboration, web-form integrations via Google Forms, and automated cloud syncs.
Choose Microsoft Excel for large datasets (10,000+ rows), advanced data modeling using Power Query/Power Pivot, and complex financial modeling.
How do I prevent employees from breaking my spreadsheet layout?
Apply data validation rules to input fields, hide your processing/staging tabs, and use the Protect Sheet function with a password on your reporting tabs. Allow editing access only to specific input ranges while locking all formula and header cells.